Rhode Island e911 Exposure Assessment
 This page offers a summary of all exposed structures in each of the 21 coastal municipalities in Rhode Island within a variety of coastal flooding scenarios: (1) from twice-daily tidesbased on sea level rise projections to the year 2100; and, (2) from coastal storm events with and without sea level rise scenarios. The data contained in the spreadsheets below present the e911 structure type data sorted by coastal flooding scenario.
PLEASE SCROLL DOWN THE PAGE TO VIEW AND/OR DOWNLOAD THE SPREADSHEETS FOR YOUR AREA OF INTEREST.
About the e-911 data:
The “e911” dataset represents the locations of all structures in Rhode Island with known street addresses. Data have been summarized for this map based upon their primary usage at the time when the location of the structure was assessed in the field by a Rhode Island Enhanced 911 Uniform Emergency Telephone System contractor.
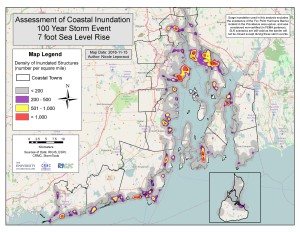
The map shown here illustrates one way to analyze these data. This map identifies coastal “hot spots” across Rhode Island where the highest number of structures per square mile are estimated to be exposed to flooding from a 100-year return period storm with 7-feet of sea level rise. Section 145 of RI CRMC’s Coastal Resources Management Program “Red Book” identifies this 7-foot sea level rise scenario as a planning target for the year 2100 based on the US Army Corps of Engineers’ Sea Level Change Curve Calculator, and the National Oceanic and Atmospheric Administration’s “high curve” for projecting sea level rise in the future.
Excel Spreadsheet Table Information
Description: Verbal description of what each site type code represents.
Exposed Structures: Number of structures exposed by greater than 0 feet of water.
Total Structures (Municipality): Number of structures total in the town.
Total Structures (SLR7_100YR): Total number of structures exposed in the worst case scenario (maximum flood envelope) of sea level rise of 7 with a 100 year storm surge.
Percent (Municipality): Percent of structures exposed out of total structures in town.
Percent (SLR7_100YR): Percent of structures exposed out of maximum flood envelope.
0-2 ft, 2-4ft, 4-6ft, >6ft: Total number of structures exposed within these intervals.
- Intervals are 0-2 ft, 2-4ft, 4-6ft, >6ft for SLR1-SLR0_500YR.
- Intervals are 0-5 ft, 5-10ft, 10-15ft, >15ft for SLR1_10YR-SLR7_100YR
Mean Elevation: Mean elevation of water for exposed structures in the municipality.
Min/Max: Min and max feet of water for exposed structures in the municipality.